DBSCAN
DBSCAN is a density-based clustering algorithm that can identify clusters of any shape in a dataset, unlike K-means which assumes that clusters are spherical. It can also identify noise points, making it particularly useful for datasets with outliers.
DBSCAN groups together data points that are close to each other based on a distance measurement (usually Euclidean distance) and a minimum number of data points. It also marks as outliers the data points that are in low-density regions.
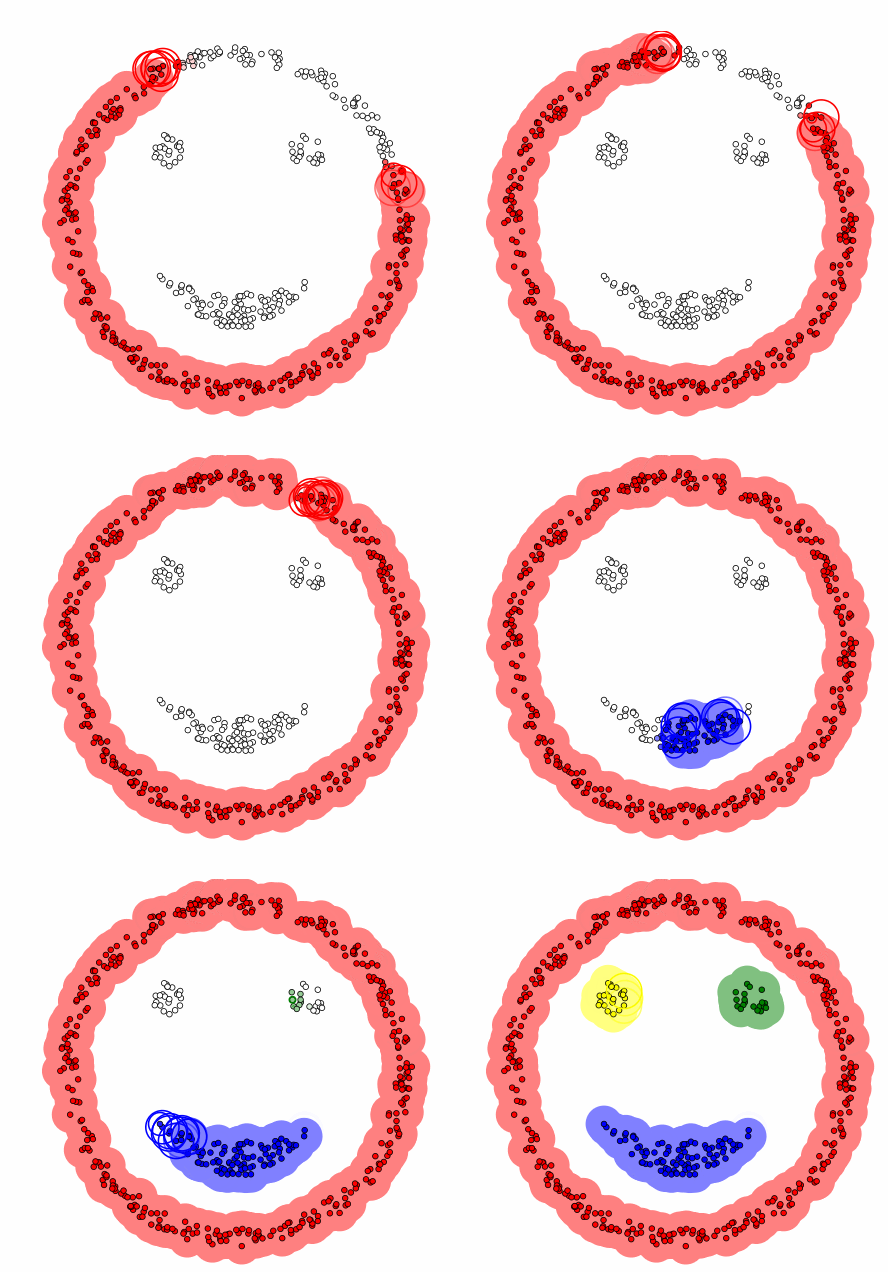
This is an animation of DBSCAN in action (source: Wikipedia) :

You can reprodue this animation here by choosing the DBSCAN algorithm and the smiley dataset. I encourage you to play with the parameters to see how they affect the clustering 😎
Algorithm idea
DBSCAN works based on two parameters: epsilon (ε) and minimum points (MinPts). The steps are:
- Randomly select a point which has not been assigned to any cluster or marked as an outlier.
- Retrieve its neighborhood: All points within distance ε.
- Expand the cluster:
- If there are MinPts within the ε distance of the point, start a new cluster.
- Add all reachable points within ε distance to the cluster.
- Repeat the process for each point in the cluster.
- Mark as outlier: If a point cannot be added to any cluster (i.e., it doesn't have MinPts within ε distance), mark it as noise or an outlier.
Mathematically, the neighborhood of a data point $P$ is defined as : $$N(P)=\{Q\in D\vert\mathrm{dist}(P,Q)\leq\epsilon\}$$
Where :
- $D$ is the dataset
- $P$ is a data point
- $Q$ is a data point in the neighborhood of $P$
- dist is the distance function between points $P$ and $Q$
Advantages and Disadvantages
Advantages
- Can find arbitrarily shaped clusters.
- Doesn't require the number of clusters to be specified.
- Can identify outliers.
Disadvantages
- Doesn't perform well with clusters of varying densities.
- Sensitive to the choice of ε and MinPts.
- Not well-suited for high-dimensional data.
Example with scikit-learn moon dataset
The moon dataset is a toy dataset to visualize clustering and classification algorithms. It consists of two interleaving half circles. It is generated using the make_moons function.
from sklearn.preprocessing import StandardScaler
import numpy as np
import pandas as pd
import matplotlib.pyplot as plt


from sklearn.datasets import make_moons
# moons_X: Data, moon_y: Labels
moons_X, moon_y = make_moons(n_samples = 2000, noise = 0.05)
import seaborn as sns
sns.scatterplot(x=moons_X[:,0], y=moons_X[:,1])
<AxesSubplot:>
from sklearn.cluster import KMeans
kmeans = KMeans(n_clusters=2)
kmeans_predict = kmeans.fit_predict(moons_X)
sns.scatterplot(x=moons_X[:,0], y=moons_X[:,1], hue = kmeans_predict)
<AxesSubplot:>
from sklearn.cluster import DBSCAN

# Generate moon-shaped data
#X, y = make_moons(n_samples=500, noise=0.05, random_state=42)

# Apply DBSCAN
dbscan = DBSCAN(eps=0.1, min_samples=5)
clusters = dbscan.fit_predict(moons_X)

# Plot the clusters
plt.scatter(moons_X[:, 0], moons_X[:, 1], c=clusters, cmap="viridis", edgecolor="k", s=50)
plt.xlabel("Feature 1")
plt.ylabel("Feature 2")
plt.title("DBSCAN Clustering on Moon Dataset")
plt.show()
Conclusion
DBSCAN is a powerful clustering algorithm that can identify complex cluster shapes and outliers. It's particularly useful for datasets where the number of clusters is unknown, and the data has noise. However, careful parameter tuning is essential for optimal results. It's great for exploratory data analysis in anomaly detection, image segmentation and spatial Data Analysis in general 🤓